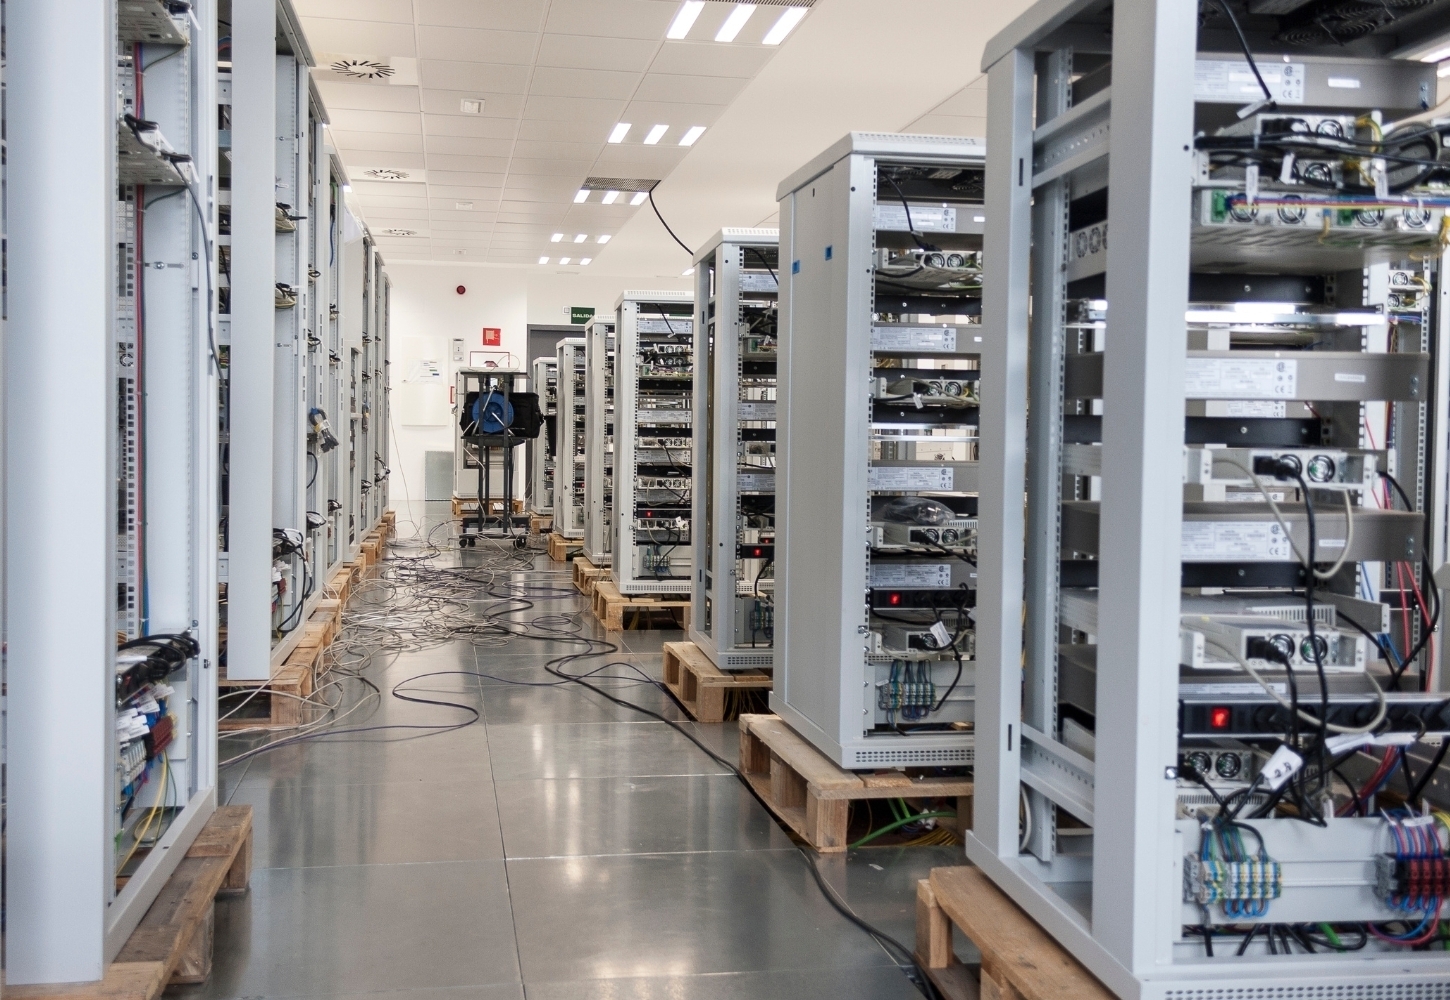
Australia and the US both tolerate data centres in theory, not next door
Using this data story? Please reference the source using one of the formats below.
Conjointly. (July 2026). Australia and the US both tolerate data centres in theory, not next door. https://brandtracker.conjointly.com/data-stories/data_centre/. Retrieved .
Conjointly. "Australia and the US both tolerate data centres in theory, not next door." Brand Tracker by Conjointly, July 2026, https://brandtracker.conjointly.com/data-stories/data_centre/. Accessed .
Conjointly. "Australia and the US both tolerate data centres in theory, not next door." Brand Tracker by Conjointly. July 2026. https://brandtracker.conjointly.com/data-stories/data_centre/. Accessed .
Conjointly ran the same set of data centre questions in the July 2026 Brand Tracker wave in Australia (n = 1,088) and the United States (n = 982), asking in both countries how much people support or oppose new data centres nationally, how that changes once it’s their own neighbourhood, and what drives support and concern.
The headline finding holds in both markets: people are considerably more comfortable with data centres in the abstract than on their own street. 27% of Australians and 25% of Americans support new data centres nationally, and that falls to 20% and 21% respectively once the question becomes local.
Beyond that headline similarity, the two countries diverge in interesting ways. Australian supporters lead with data sovereignty (keeping data stored onshore, 65%), while Americans lead with the economic case (jobs and investment, 58%). Age behaves differently too: in Australia, support rises steadily with age, while in the US it stays flat across age groups. Among those who oppose or are neutral on data centres, concern about the strain on power and water supply also grows sharply with age in both countries, and even more so in the US.
Do people want new data centres nationally?
Question 1: To what extent do you support or oppose the construction of new data centres in Australia?
n = 1,088
Question 1: To what extent do you support or oppose the construction of new data centers in the United States?
n = 982
Support is nearly identical, but the shape of the disagreement isn’t: Americans are more likely to actively oppose data centres (45% vs 31% in Australia), while Australians are more likely to sit on the fence. Americans have more often made up their minds, and slightly more of them have landed on “no.”
By segment
The line bar marks the overall average for "somewhat or strongly support" (27%).
Gender
(n = 483)
(n = 605)
Age
(n = 157)
(n = 560)
(n = 371)
The line bar marks the overall average for "somewhat or strongly support" (25%).
Gender
(n = 441)
(n = 541)
Age
(n = 134)
(n = 492)
(n = 356)
The gender gap is similar in both countries (men roughly 10 points more supportive than women), but age cuts in opposite directions. In Australia, support rises steadily from 20% to 33%. In the US, support is essentially flat across age groups. Under-30s in the US are actually more supportive than their Australian counterparts, the only segment where the US leads Australia on national support.
Would they want one in their own neighbourhood?
Question 2: And to what extent would you support or oppose the construction of a new data centre in your neighbourhood?
n = 1,088
Question 2: And to what extent would you support or oppose the construction of a new data center in your neighborhood?
n = 982
Both countries show the classic NIMBY (Not In My Back Yard) drop, but it’s steeper in Australia, falling from 27% to 20% nationally to locally. In the US, it falls from 25% to 21%. Americans are more likely than Australians to strongly oppose data centres even at the national level, and that gap widens further at the local level.
By segment
The line bar marks the overall average for "somewhat or strongly support" (20%).
Gender
(n = 483)
(n = 605)
Age
(n = 157)
(n = 560)
(n = 371)
The line bar marks the overall average for "somewhat or strongly support" (21%).
Gender
(n = 441)
(n = 541)
Age
(n = 134)
(n = 492)
(n = 356)
The most striking difference is with over-55s. In Australia, they’re the most supportive age group nationally (33%), but they drop the most once it’s local (21%). In the US, over-55s were never the most supportive nationally, but they end up the least supportive age group locally.
What makes supporters back data centres?
Question 3 : Which of the following, if any, are reasons you would support the construction of new data centres?
% of supporters citing each reason (respondents who are somewhat/strongly supportive of data centres nationally, n=298 in AU and n=245 in the US).
The two countries tell different stories here. Australian supporters rank keeping data stored onshore well above everything else (65%), with job creation a clear second (59%). Americans flip that order: jobs and investment leads (58%), while onshore data storage (49%) is a strong second but doesn’t stand out the way it does in Australia. Beyond the top two, the ranking order matches closely in both countries, with comparable gaps throughout, though every reason scores higher in Australia overall, mostly because Australian supporters tend to pick multiple reasons.
By segment
% of supporters selecting each reason, by segment.
| Male n = 166 | Female n = 132 | Under 30 n = 31 | 30–55 n = 145 | Over 55 n = 122 | |
|---|---|---|---|---|---|
| Keep Australian data stored onshore | 65% | 65% | 36% | 61% | 77% |
| Create jobs and investment locally | 56% | 63% | 39% | 61% | 62% |
| Support the digital services I use every day | 52% | 55% | 58% | 54% | 51% |
| Help Australia compete in AI | 57% | 46% | 32% | 55% | 55% |
| Strengthen national security and tech independence | 52% | 49% | 45% | 49% | 53% |
| Drive investment in new energy infrastructure | 42% | 33% | 39% | 41% | 34% |
| None of the above | 1% | 2% | 3% | 1% | 2% |
% of supporters selecting each reason, by segment.
| Male n = 133 | Female n = 112 | Under 30 n = 32 | 30–55 n = 126 | Over 55 n = 87 | |
|---|---|---|---|---|---|
| Keep American data stored onshore | 51% | 46% | 50% | 39% | 62% |
| Create jobs and investment locally | 56% | 61% | 44% | 54% | 69% |
| Support the digital services I use every day | 50% | 45% | 38% | 52% | 45% |
| Help the US compete in AI | 56% | 35% | 25% | 40% | 63% |
| Strengthen national security and tech independence | 51% | 37% | 28% | 42% | 54% |
| Drive investment in new energy infrastructure | 36% | 28% | 44% | 32% | 29% |
| None of the above | 0% | 5% | 6% | 2% | 2% |
Gender is consistent in both countries: men and women agree on the top reason, but men favour the AI-competitiveness argument more than women, the biggest gender gap on the list. Age is also consistent on two reasons: over-55s rank data sovereignty and national security above every other age group, in both countries. One US-only pattern: over-55s there are also the strongest AI-competitiveness advocates of any age group, while in Australia that reason is roughly tied between the two older groups.
What makes people concerned?
Question 4: Which of the following, if any, concern you about the construction of new data centres?
% of sceptics citing each reason (respondents who oppose or are neutral on data centres nationally, n=790 in Australia, n=737 in the US)
Infrastructure strain worries both countries most, but Americans feel it more: grid pressure, energy bills, and water use for cooling all rank higher in the US. Data privacy is the one exception, with Australia edging ahead. All other concerns sit at similar levels in both countries, and both agree “few ongoing jobs” is the weakest concern.
By segment
% of sceptics (those who oppose or are neutral) selecting each reason, by segment.
| Male n = 317 | Female n = 473 | Under 30 n = 126 | 30–55 n = 415 | Over 55 n = 249 | |
|---|---|---|---|---|---|
| High electricity use and grid pressure | 49% | 50% | 36% | 46% | 63% |
| High water use for cooling | 47% | 42% | 39% | 39% | 55% |
| Data privacy and security risks | 38% | 47% | 41% | 42% | 47% |
| Higher energy bills for households | 40% | 43% | 36% | 40% | 49% |
| Land use, taking space from housing or farmland | 40% | 43% | 36% | 38% | 49% |
| Environmental impact and carbon emissions | 39% | 43% | 37% | 40% | 45% |
| Noise, traffic or visual impact | 38% | 41% | 38% | 39% | 42% |
| Create few ongoing jobs once built | 25% | 21% | 22% | 19% | 29% |
| None of the above | 12% | 12% | 11% | 14% | 10% |
% of sceptics (those who oppose or are neutral) selecting each reason, by segment.
| Male n = 308 | Female n = 429 | Under 30 n = 102 | 30–55 n = 366 | Over 55 n = 269 | |
|---|---|---|---|---|---|
| High electricity use and grid pressure | 55% | 60% | 40% | 53% | 71% |
| High water use for cooling | 54% | 51% | 47% | 43% | 67% |
| Data privacy and security risks | 33% | 45% | 43% | 38% | 42% |
| Higher energy bills for households | 50% | 58% | 41% | 52% | 63% |
| Land use, taking space from housing or farmland | 39% | 46% | 32% | 43% | 47% |
| Environmental impact and carbon emissions | 37% | 48% | 33% | 43% | 48% |
| Noise, traffic or visual impact | 40% | 44% | 39% | 41% | 46% |
| Create few ongoing jobs once built | 19% | 21% | 21% | 16% | 25% |
| None of the above | 8% | 10% | 8% | 11% | 7% |
The clearest finding in this comparison is the age gap: in both countries, over-55 non-supporters worry far more than under-30s about the physical footprint of data centres, a 27-point gap in Australia and 31 points in the US. Whatever a country’s overall stance on data centres, the generational split in what people worry about looks remarkably similar.
Implications
The level of support for data centres looks similar on the surface in Australia and the US: roughly a quarter of the public backs them nationally, and support drops once it’s local in both places, though the US has more opponents both nationally and locally. But the reasoning underneath differs. In Australia, opinion is driven most on keeping data onshore; in the US, employment and local investment carry the argument.